
Rent vs buy in St. Peters, MO
In St. Peters, Missouri, a typical rent is $1,687 each month, while a typical home is valued at $320,850.
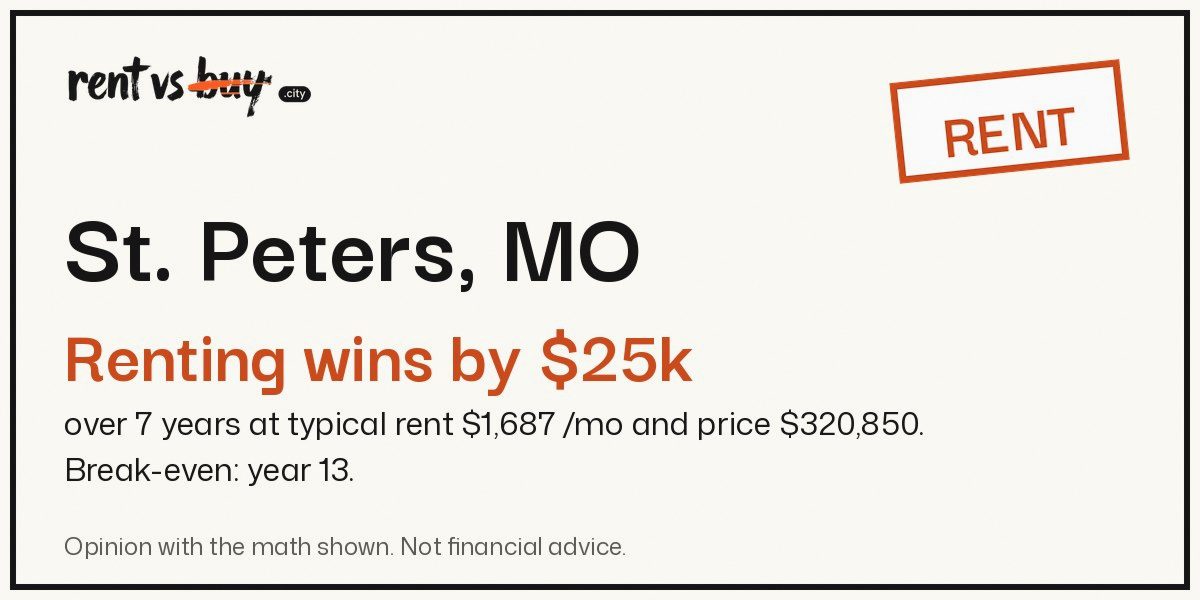
Renting saves you $25k over 7 years
With the typical rent and home value in St. Peters, 20% down and today's mortgage rate. Costs break even in year 13.
An opinion that's clearly labeled, with the math shown. These figures are estimates, not quotes. Adjust one number, and the stamp changes accordingly.
- How far renting is ahead
- $25k after 7 years
- When costs break even
- year 13 when owning catches up
- What owning really costs
- Each month: $2,909 year 1, against $1,687 rent
Change my numbers
The stamp reflects the typical rent and home value for St. Peters. Your rent, price and years can change the outcome.
Do these figures differ from the city's?
Enter your rent, price and down payment. The stamp updates with your entries.
In St. Peters, is renting or buying cheaper?
Renting costs $25,224 less over 7 years when you include the money you get back when you sell. For the first 12 years, renting costs less. By year 13, owning has caught up.
Renting wins. Cost of owning. Net cost to date, by year.
Average rent compared with the mortgage payment in St. Peters
Rent and mortgage payments aren't the entire story. Using the typical price in St. Peters, these are all monthly costs for year 1.
| Each month, year 1 | Amount | What it is |
|---|---|---|
| Rent | $1,687 | All of it, every month |
| Mortgage payment | $1,749 | $1,542 of it is interest in year 1 |
| Property tax | $318 | 1.19% of the value a year |
| Insurance | $126 | Census median for the city |
| Upkeep | $267 | 1% of the value a year |
| Owning, cash out | $2,461 | $207 of it builds equity |
| Lost return on the down payment | $522 | What the cash would earn each year at 8.3% |
| Buying costs, spread out | $134 | 3.5% of the price over 7 years |
| True cost of owning | $2,909 | Cash out minus the equity part, plus the two amounts above |
The figures behind St. Peters's result
- Typical home valueZillow ZHVI, September 2026
- $320,850
- Typical rentZillow ZORI, September 2026
- $1,687 /mo
- Down payment20% avoids private mortgage insurance, which the engine does not model
- 20%
- Mortgage rateFreddie Mac Primary Mortgage Market Survey (FRED MORTGAGE30US)
- 7.24%
- Home price growthFHFA house price index, Missouri, 1995 to 2025
- 4% a year
- Rent growthCPI rent of primary residence, yearly growth 2006 to 2026
- 3.5% a year
- Return on savings60% S&P 500 with dividends and 40% 10-year Treasuries, rebalanced yearly, 1928 to 2025
- 8.3% a year
- Property taxCensus ACS 2020-2024, St. Peters
- 1.19% of value
- Home insuranceCensus ACS 2020-2024, St. Peters
- $126 /mo
- MaintenanceFannie Mae, low end of 1% to 4%
- 1% of value a year
- Buying costsFreddie Mac, middle of 2% to 5%
- 3.5% of price
- Selling costsAgent commission plus closing costs
- 6% of price
What would flip the outcome in St. Peters?
Each line shows where St. Peters's 7-year result changes, with all other factors staying the same.
Renting is better when
- Home prices grow by less than 5.0% each year (Missouri's long-run rate is 4%, our assumption).
- The mortgage rate remains higher than 5.84%.
- A similar home rents for under $1,960 a month (the typical rate here is $1,687).
- Before year 13, you move.
When buying comes out ahead
- Annual home price growth exceeds 5.0%.
- You lock in a mortgage rate under 5.84%. Today, it stands at 7.24%.
- For you to rent the same home, it would cost more than $1,960 each month.
- Your stay lasts 13 years or more.
How St. Peters compares with 812 other cities
| Measure | St. Peters | Median city |
|---|---|---|
| Typical home value | $320,850 | $422,451 |
| Typical rent | $1,687 /mo | $1,837 /mo |
| Price-to-rent ratio | 15.8 (#569 of 813) | 18.5 |
| Home prices, last 10 years | 6.4% a year | 6.2% a year |
| Rents, last 5 years | 4.8% a year | 4% a year |
| Property tax | 1.19% | 0.87% |
| Households that rent | 21% | 42% |
Sources: Zillow ZHVI and ZORI, Census ACS 2020-2024.
Cities elsewhere in Missouri
- Renting saves $9k in Kansas City, MO.
- Buying saves $16k in St. Louis, MO.
- Renting saves $20k in Springfield, MO.
- Renting saves $39k in Columbia, MO.
- Buying saves $9k in Independence, MO.
- Renting saves $72k in Lee's Summit, MO.
- Renting saves $41k in O'Fallon, MO.
- Renting saves $53k in St. Charles, MO.
- Renting saves $8k in St. Joseph, MO.
- Renting saves $16k in Blue Springs, MO.
- In Joplin, MO, renting leads by $3k in a toss-up.
- Buying saves $37k in Florissant, MO.