
Rent vs buy in Torrance, CA
The typical rent in Torrance, California is $3,006 /mo, and the typical home value is $1,100,115.
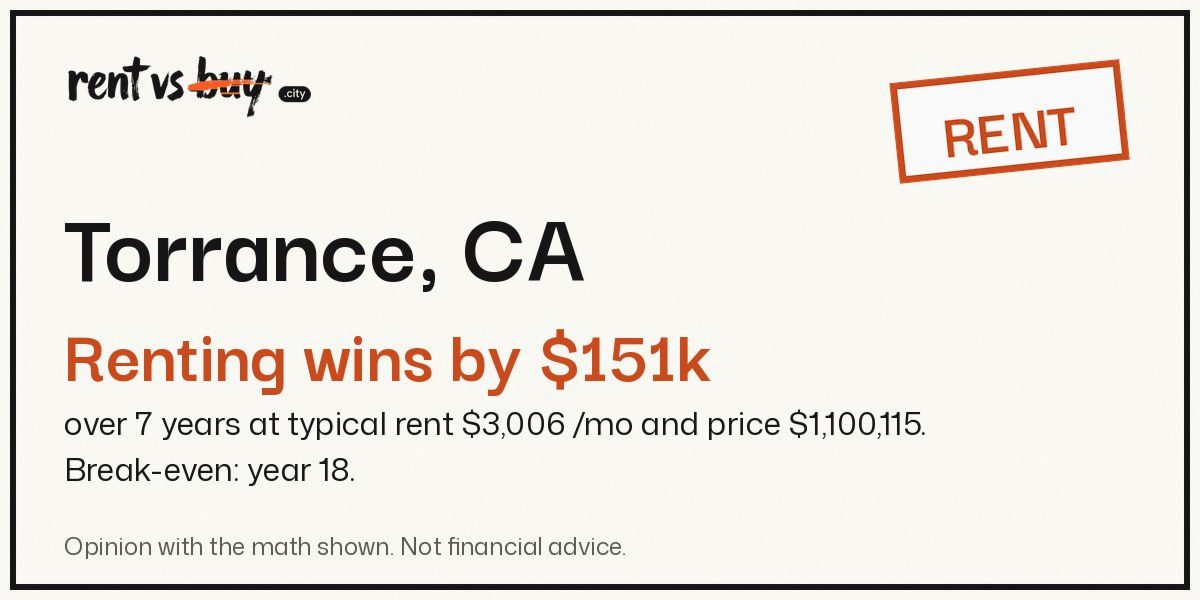
Over 7 years, renting comes out ahead by $151k
Based on Torrance's typical rent and home value, the figures include 20% down and today's mortgage rate. The break-even year is 18.
Clearly labelled opinion with the calculations displayed. These figures are estimates, not quotes. Adjust any one number and the stamp updates.
- Renting leads by
- $151k after 7 years
- Break-even point
- year 18 when owning catches up
- Real cost of owning
- $9,124 /mo year 1, against $3,006 rent
Change my numbers
The stamp takes its rent and home value from Torrance's typical figures. Change your rent, your price or your years and the verdict can flip.
Do your numbers not match the city's?
Enter the rent, price and down payment amounts you want to use. Any change to those figures shows up in the stamp.
Is it cheaper to rent or buy in Torrance?
During 7 years, renting costs $151,127 less, including the money returned to you when you sell. For the first 17 years, renting costs less. In year 18, owning catches up with renting.
Renting. Owning. Net cost to date, by year.
Average rent compared with the mortgage payment in Torrance
At Torrance's typical price, here are all monthly costs for year 1. Rent and the mortgage are only part of the total.
| Each month, year 1 | Amount | What it is |
|---|---|---|
| Rent | $3,006 | All of it, every month |
| Mortgage payment | $5,998 | $5,287 of it is interest in year 1 |
| Property tax | $578 | 0.63% of the value a year |
| Insurance | $97 | Census median for the city |
| Upkeep | $917 | 1% of the value a year |
| Owning, cash out | $7,589 | $711 of it builds equity |
| Lost return on the down payment | $1,788 | At 8.3% a year, that's what the cash could earn. |
| Buying costs, spread out | $458 | 3.5% of the price over 7 years |
| True cost of owning | $9,124 | Deduct the equity portion from cash paid, then add both amounts shown above. |
Torrance: the numbers behind the verdict
- Typical home value: Zillow ZHVI, September 2026
- $1,100,115
- Zillow ZORI, September 2026 gives the typical rent
- Monthly amount: $3,006
- With 20% down, private mortgage insurance is avoided, but the engine does not model it.
- 20%
- Rate used: Freddie Mac Primary Mortgage Market Survey (FRED MORTGAGE30US)
- 7.24%
- FHFA house price index, California, 1995 to 2025 shows home price growth
- Each year: 5.3%
- Rent growth Primary residence CPI rent, yearly change between 2006 and 2026
- Each year: 3.5%
- Savings return60% S&P 500 with dividends plus 40% 10-year Treasuries, rebalanced each year, 1928 to 2025
- 8.3% each year
- Property tax: Census ACS 2020-2024, Torrance
- 0.63% of the value
- Home insurance: Census ACS 2020-2024, Torrance
- $97 monthly
- Upkeep: Fannie Mae, low end of 1% to 4%
- Each year: 1% of value
- Buying costs Freddie Mac, midpoint between 2% and 5%
- Applied to the price: 3.5%.
- Costs of sellingAgent commission plus closing costs
- 6% of the price
What would change the result in Torrance?
Every line shows a threshold that changes the 7-year verdict in Torrance, while all other figures stay fixed.
When renting wins
- Annual home price growth is under 6.8%. The calculation uses 5.3%, California's long-run rate.
- A mortgage rate remains above 4.79%.
- Renting a similar home costs less than $4,620 monthly, while the local typical figure is $3,006.
- Before year 18, you move.
When buying wins
- Annual home price growth exceeds 6.8%.
- You lock in a rate below 4.79%, compared with today's 7.24%.
- The same home would cost more than $4,620 a month to rent.
- You stay 18 years or more.
Torrance compared with the other 812 cities
| Measure | Torrance | Median city |
|---|---|---|
| Typical home value | $1,100,115 | $422,451 |
| Typical rent | $3,006 /mo | $1,837 /mo |
| Price-to-rent ratio | 30.5 (#65 of 813) | 18.5 |
| Home prices, last 10 years | 6.2% a year | 6.2% a year |
| Rents, last 5 years | 4.4% a year | 4% a year |
| Property tax | 0.63% | 0.87% |
| Households that rent | 45% | 42% |
Sources: Zillow's ZHVI, ZORI, Census ACS 2020-2024.
Other California cities
- Rent. Los Angeles, CA. Renting leads by $111k.
- Rent. San Diego, CA. Renting comes out ahead by $108k.
- Rent. San Jose, CA. Renting comes out ahead by $210k.
- Rent. San Francisco, CA. Renting comes out ahead by $128k.
- Buy. Fresno, CA. Buying comes out ahead by $22k.
- Toss-up. Sacramento, CA. Renting leads by $3k.
- Rent. In Long Beach, CA, renting saves you $111k.
- Rent. Oakland, CA. Renting comes out ahead by $44k.
- Buy. Bakersfield, CA. Buying comes out ahead by $11k.
- Renting wins by $115k in Anaheim, CA.
- Buying wins by $16k in Stockton, CA.
- Renting wins by $27k in Riverside, CA.