
Rent vs buy in Westfield, IN
For Westfield, Indiana, the typical rent is $1,922 /mo and the typical home price is $475,645.
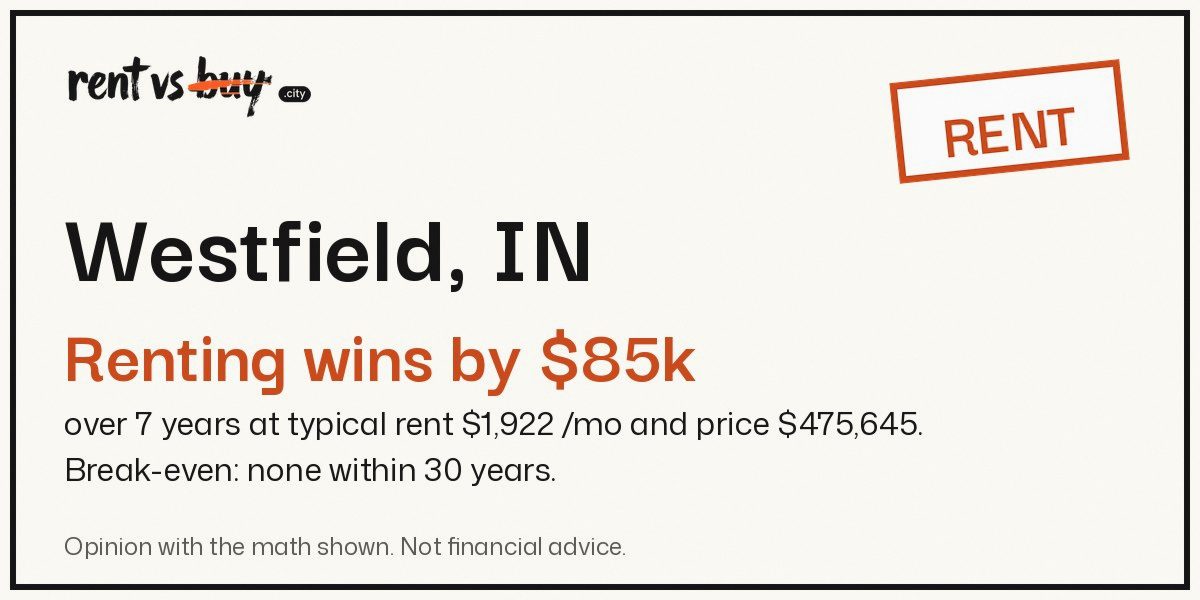
Across 7 years, renting comes out ahead by $85k.
Today's mortgage rate, 20% down and Westfield's typical rent and home value form the basis of the comparison. No break-even occurs within 30 years.
Clearly labeled opinion, with the math shown. These figures are estimates, not quotes. If you change a number, the stamp changes too.
- Renting leads by
- $85k after 7 years
- Break-even point
- A period of 30+ years owning never catches up sooner
- Owning's full cost
- $4,122 each month year 1, against $1,922 rent
Change my numbers
The stamp takes its inputs from Westfield's typical home value and rent. Your figures for rent, price and years can change the outcome.
Do your numbers differ from the city's?
Enter the rent, price and down payment you want. Your entries change the stamp.
Which costs less in Westfield, renting or buying?
After the money you receive from a sale is counted, renting costs $85,353 less over 7 years. Every year shown has a lower net cost for renting. Buying never catches up within 30 years.
Rent Homeownership. Net cost through each year
Westfield: average rent compared with mortgage payment
Rent and mortgage payments don't cover the full cost. Here are all monthly costs in year 1 using Westfield's typical price.
| Each month, year 1 | Amount | What it is |
|---|---|---|
| Rent | $1,922 | All of it, every month |
| Mortgage payment | $2,593 | $2,286 of it is interest in year 1 |
| Property tax | $353 | 0.89% of the value a year |
| Insurance | $116 | Census median for the city |
| Upkeep | $396 | 1% of the value a year |
| Owning, cash out | $3,458 | $308 of it builds equity |
| Lost return on the down payment | $773 | What the cash would earn yearly at 8.3% |
| Buying costs, spread out | $198 | 3.5% of the price over 7 years |
| True cost of owning | $4,122 | Cash out, subtract equity, then add both entries above |
Westfield verdict: the numbers behind it
- Typical home valueZillow ZHVI, September 2026
- $475,645
- Typical rentZillow ZORI, September 2026
- $1,922 /mo
- Down payment20% avoids private mortgage insurance, which the engine does not model
- 20%
- Mortgage rateFreddie Mac Primary Mortgage Market Survey (FRED MORTGAGE30US)
- 7.24%
- Home price growthFHFA house price index, Indiana, 1995 to 2025
- 3.7% a year
- Rent growthCPI rent of primary residence, yearly growth 2006 to 2026
- 3.5% a year
- Return on savings60% S&P 500 with dividends and 40% 10-year Treasuries, rebalanced yearly, 1928 to 2025
- 8.3% a year
- Property taxCensus ACS 2020-2024, Westfield
- 0.89% of value
- Home insuranceCensus ACS 2020-2024, Westfield
- $116 /mo
- MaintenanceFannie Mae, low end of 1% to 4%
- 1% of value a year
- Buying costsFreddie Mac, middle of 2% to 5%
- 3.5% of price
- Selling costsAgent commission plus closing costs
- 6% of price
Which changes would reverse the Westfield result?
With all other figures unchanged, each line marks where the 7-year Westfield verdict switches.
When renting wins
- Annual home price growth under 5.9% (we apply 3.7%, Indiana's long-run rate).
- A mortgage rate above 4.02% stays in place.
- A home like this has a monthly rent below $2,840, while the typical rent here is $1,922.
- You move at any time during the next 30 years, and owning never catches up with these numbers.
When buying wins
- Home prices rise faster than 5.9% a year.
- Today's mortgage rate is 7.24%. The rate you lock in is below 4.02%.
- Monthly rent for the same home would run above $2,840.
How Westfield compares with the other 812 cities
| Measure | Westfield | Median city |
|---|---|---|
| Typical home value | $475,645 | $422,451 |
| Typical rent | $1,922 /mo | $1,837 /mo |
| Price-to-rent ratio | 20.6 (#305 of 813) | 18.5 |
| Home prices, last 10 years | 5.9% a year | 6.2% a year |
| Rents, last 5 years | 5% a year | 4% a year |
| Property tax | 0.89% | 0.87% |
| Households that rent | 21% | 42% |
Sources: Zillow ZHVI and ZORI, Census ACS 2020-2024.
Other Indiana cities
- Close result. Indianapolis, IN. Renting leads by $2k.
- Rent. Fort Wayne, IN. The result favors renting by $20k.
- Rent. Evansville, IN. Renting saves you $17k.
- Rent. Fishers, IN. Renting saves you $70k.
- Buy. South Bend, IN. Buying saves you $4k.
- Rent. Carmel, IN. Renting saves you $143k.
- Rent. Bloomington, IN. Renting saves you $9k.
- Buy. Hammond, IN. Buying saves you $37k.
- Rent. Noblesville, IN. Renting saves you $62k.
- Rent. Lafayette, IN. Renting saves you $24k.
- Rent. Greenwood, IN. Renting saves you $33k.
- Buy. Gary, IN. Buying saves you $72k.